Europe
Asia
Oceania
Americas
Africa
Professor Newman on…
Introducing a new graph for visualisin
Sony’s enthusiast-focused all-rounder brings major updates and performance boosts, but is that enough to bring it back to the top of its highly competitive class? Andy Westlake finds out
Charlotte Beutler’s still-life photo comes under our microscope
Spotlight on readers’ excellent images and how they captured them
Wendy Evans goes through the techniques required to shoot train stations after dark, when metering the variable light is a challenge
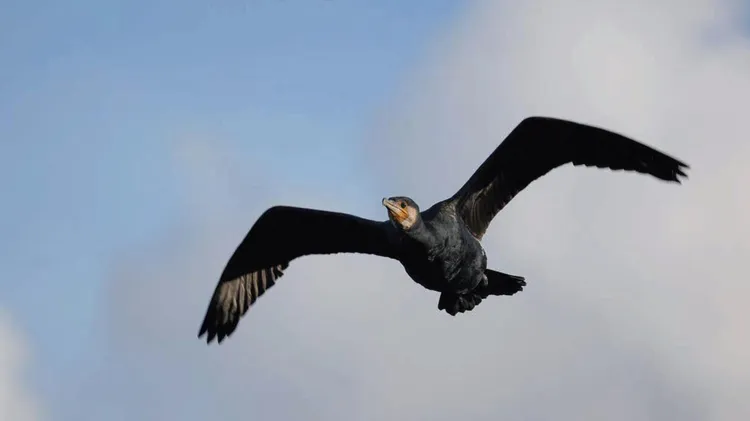
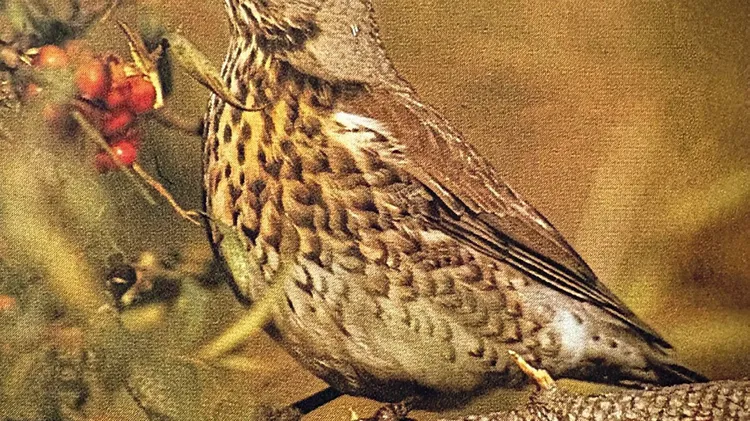
Rob Read examines how advances in camera technology have revolutionised the way we capture images of birdlife
Photographer and educator www.nickchurchcreativeacademy.com