Europe
Asia
Oceania
Americas
Africa
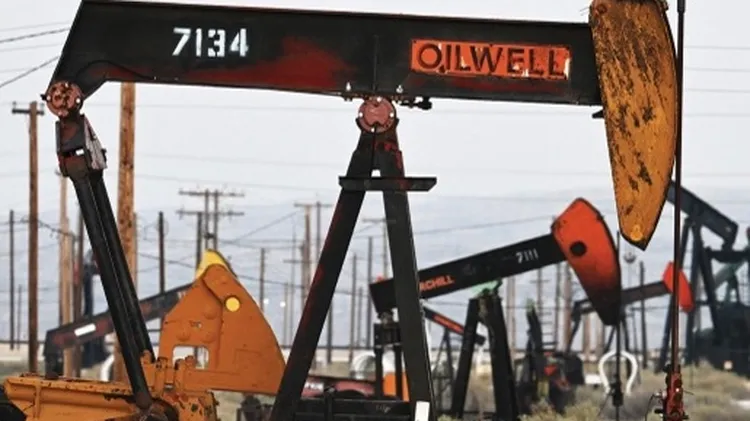
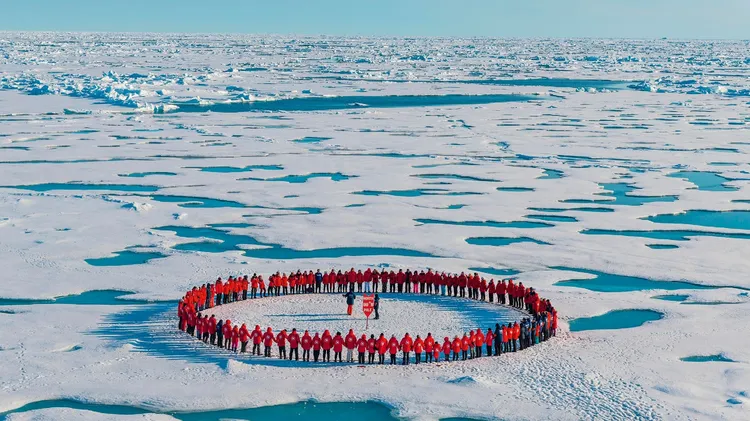
BY MICHAEL E. MANN
CLIMATE
ON APRIL 22 (EARTH
“The failure of economists to forecast recessions is virtually unblemished,” notes Prakash Loungani, assistant director at the International Monetary Fund (IMF). This includes the economists at the IM
Why is it important to notice the changing of the seasons and how does it help our understanding of nature? It’s fun and satisfying to notice changes with each passing day. And the things we enjoy doi
Daniel Pembrey picks out his top travel books of 2025
I wonder how many of you watched a TV programme that dealt with the awful winter of 1947? It was fascinating for me to watch because it brought back so many memories of the dreadful time for my parent
Indoor training is a triathlete’s off-season staple due to the technological revolution and apps like Zwift; heat training is very much in vogue due to research over the past few years extolling the b
WE ARE NOW IN THE NEXT STAGE of legislators doing their utmost to destabilise the European car industry, with the announcement that the total ban on the sale of internal combustion-engined cars, which